.png)


Vegetation indices are calculated using a combination of two or more eflectance bands from satellite imagery.
What are reflectance bands? Well, you first need to understand how the human eye perceives color. Why do oceans appear blue, and leaves green, etc.? In fact, everything on Earth reflects back radiation, which is light energy, at different wavelengths. Some of these wavelengths can be perceived by the human eye as colors. Other wavelengths can be seen by certain animals, cameras, or special sensors. Satellites are equipped with these sensors and can detect some specific wavelengths through reflectance bands.

The bands in the first zone are in the visible wavelength spectrum (RGB: red, green and blue) and provide information on leaf pigmentation , which is useful in determining the growth stage of a crop and can be a basic indicator of crop health.
The near-infrared (NIR) wavelengths in the second zone are a great way to identify healthy growing plants by detecting chlorophyll, which is a more direct representation of plant productivity.
Bands in the shortwave infrared (third zone) provide information on the water content of the plants, as well as biochemical components in the leaves.
For more than 30 years, NDVI (Normalized Difference Vegetation Index) has been the reference index in agriculture. It combines visible and near infrared bands to provide information on canopy density and greenness. NDVI is a great starting point for understanding crop growth during a growing season, making it the "go-to" VI for many agricultural users.
Older satellites could record NDVI at 30 meters resolution, and more recently at 10 meters. In recent years, there has been a race to provide NDVI maps at the highest resolution possible, as if this was the ultimate solution. However, this is not necessarily the only possible solution. Higher resolution provides more accurate information. But instead of trying to see more by zooming in with the same index, why not change the measuring tool? Depending on your application, other indices may be a better fit.
Below is a selection of VIs that are relevant to agriculture today. They are divided into two categories: Crop Activity and Crop Productivity VIs.
The following indices provide information on the current physical condition of plants, including coloration, density, and water content
While plant coloration and density are certainly related to productivity, the following indices are better at estimating yield and providing insights into the biochemical state of the plant
From the list of nearly 250 available indices from Sentinel-2 alone, the most widely used Earth observation satellite in Europe, more than 130 can be useful for vegetation monitoring. So, which index is the best for your farm? Well, that depends on several questions, including:
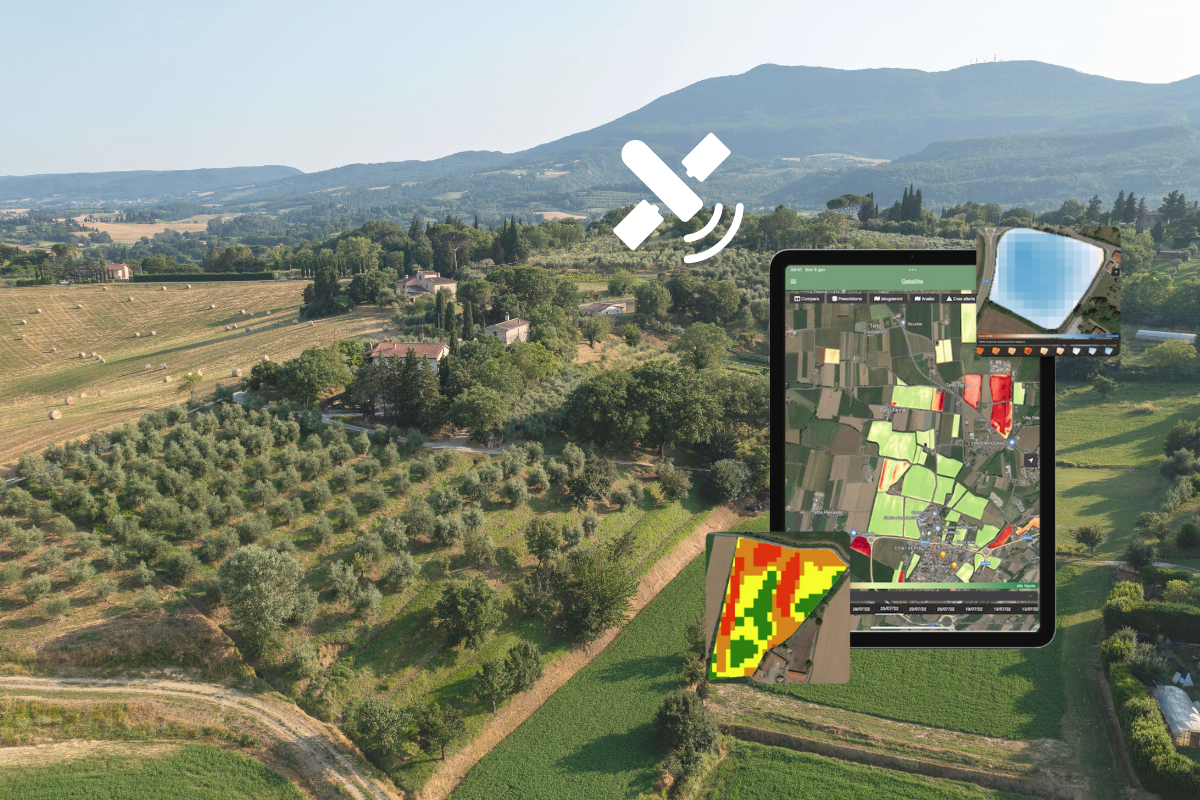
In the xFarm platform , you will find all of the VIs listed in this article, and get the most appropriate solution for your farm . Satellite data is updated every 5 days, so you can make decisions based on the most up-to-date information. Not only will you be able to constantly monitor your crops, but you will also be able to take advantage of various applications of the indices, including the creation of prescription maps directly on the platform.


.svg)